
Monitoring the health of your application in production is a crucial aspect of software development because at any given point in time, you want to be reasonably certain about how your business critical application is performing and you want to be alerted to any problems that might be brewing up in the application before your customers do. It gets even more important as we build more and more distributed architectures because the number of things that can fail or degrade suddenly gets really high.
In this post I show one way to do health monitoring and reporting for applications hosted under the PaaS App Service model on Azure.
I have a web application (built using ASP.NET Core 2.2 with SQL Server backend database) deployed on Azure that I wanted to monitor the health of regularly but without having to do so manually (or relying on out of the box Azure AppService metrics because I don’t want to couple with Azure metrics too much and want to retain some control over how I monitor my apps). The application is primarily only for personal usage but its still helpful to have some sort of health monitoring for it and be alerted automatically as soon as the application starts acting up.
I wanted to use DataDog for recording health metrics and alerting because I am already familiar with it. My application is an Azure AppService application i.e. I don’t have access to the underlying host. Apparently, this makes a big difference in terms of what kind of health monitoring architecture I can build. Let me explain.
Traditionally, health monitoring in a VM based environment is a little more straightforward because you can install an agent process on the host while provisioning it (this is what we do at work where we use AWS EC2 instances for all our applications with one app per EC2 instance).
This agent process runs a script every ‘x’ minutes to poll the health of the application running on that VM. It does this by querying a well known health endpoint exposed by the application. The health endpoint responds by running the health checks for all the immediate dependencies of the applicaton for e.g. databases, services etc, collating results from all of them and returning an aggregate result i.e. if even one service is unhealthy, the overall application is reported as unhealthy. This is desirable from a monitoring perspective because an application might not be usable if the one (or more) of the dependencies is unhealthy.
In my case, I didn’t have that flexibility so I had to create my own “agent” process that will do the same thing for me. The design that I had in mind was this (this is very similar to how we monitor application health at work albeit using AWS instead of Azure):

I will break this down in 4 parts:
- Adding health checks to the application on a known endpoint and have the health report be emitted when that endpoint is queried
- Building some kind of agent process or script that can regularly poll this health endpoint, parse the response and submit the health metric to DataDog for dashboarding and alerting.
- Building the dashboard in DataDog.
- Setting up automated alerting.
Part 1: Adding health checks to the application
Up until ASP.NET Core 2.0 (and even 2.1), there was no good built in way of adding health checks to your application runtime pipeline, you pretty much had to hand roll your own health check abstractions and implementations and find a way to poll them regularly.
ASP.NET Core 2.2 has changed all that by introducing health checks out of the box that can be plugged into the application using middleware from this namespace: Microsoft.AspNetCore.Diagnostics.HealthChecks.
So I first started by adding the health check middleware that I configured to provide a pre-determinded health endpoint, into my application’s pipeline (in Startup.cs):
| public void Configure( | |
| IApplicationBuilder app, | |
| IHostingEnvironment env) | |
| { | |
| app.UseHealthChecks("/health/status"); | |
| // rest of the pipeline | |
| } |
By default the health check middleware simply returns a string “Healthy”/”Unhealthy” which is OK if I am only checking the health of one service and there are no further dependencies. If however, I have multiple services that my application relies upon (which is a majority of real apps), then the simple string is useless because it doesn’t tell me what exactly is not healthy.

It turns out the health check middleware provides a handy way to override the outgoing response by overriding the ResponseWriter so I changed the middleware configuration to as shown in the gist below:
| public void Configure( | |
| IApplicationBuilder app, | |
| IHostingEnvironment env) | |
| { | |
| app.UseHealthChecks("/health/status", | |
| new HealthCheckOptions | |
| { | |
| ResponseWriter = async (httpContext, healthReport) => | |
| { | |
| var healthReportJson = JsonConvert.SerializeObject(healthReport); | |
| await httpContext.Response.WriteAsync( | |
| healthReportJson, Encoding.UTF8); | |
| } | |
| }); | |
| // rest of the pipeline | |
| } |
I simply included the whole HealthReport instance, that is generated out of the box anyway and contains the aggregate as well as per dependency health check result, in the response. This will be parsed by the agent process in part 2.
In order to monitor the connectivity to the SQL Server backend database, I created a custom health check by implementing the IHealthCheck interface:
| using Microsoft.EntityFrameworkCore; | |
| using Microsoft.Extensions.Diagnostics.HealthChecks; | |
| using System.Threading; | |
| using System.Threading.Tasks; | |
| public class DatabaseHealthCheck : IHealthCheck | |
| { | |
| private readonly DbContext dbContext; | |
| public DatabaseHealthCheck(DbContext context) | |
| { | |
| this.dbContext = context; | |
| } | |
| public async Task<HealthCheckResult> CheckHealthAsync( | |
| HealthCheckContext context, | |
| CancellationToken cancellationToken = default(CancellationToken)) | |
| { | |
| var canConnectToDatabase = | |
| await dbContext.Database.CanConnectAsync(); | |
| if (canConnectToDatabase) | |
| return HealthCheckResult.Healthy(); | |
| return HealthCheckResult.Unhealthy(); | |
| } | |
| } |
Essentially it will simply try opening and closing the connection to the database upon each health check request, if the connection fails it will report itself as unhealthy otherwise, healthy. This is a crucial health check for my application because without the backend database, the application can’t really do anything useful. Even though I have designed the application to be fault tolerant enough such that if the database is not available, it won’t throw the dreaded “yellow page of death” (or “white page of death” for ASP.NET Core apps) and respond to the user with a polite “Try again later message”, its still important for me to know what part of the application is failing so appropriate recovery can be applied.
Finally, I added this custom health check to the DI container (thanks to the fluent API, I could simply add more health checks down the line if I need to, add appropriate dashboard for it and I am good to go):
| public void ConfigureServices(IServiceCollection services) | |
| { | |
| services.AddDbContext<PeriodContext>(options => | |
| options.UseSqlServer( | |
| Configuration.GetConnectionString("DbConnectionString"), | |
| builderOptions => | |
| builderOptions.EnableRetryOnFailure(3)), | |
| ServiceLifetime.Scoped); | |
| services.AddHealthChecks() | |
| .AddCheck("SQL Server", | |
| new DatabaseHealthCheck( | |
| services.BuildServiceProvider() | |
| .GetService<PeriodContext>())); | |
| // rest of the services | |
| } |
Naming the health check will prove really helpful later on when I am sifting through metrics in DataDog looking for my application metric because I will have a way of identifying the metric using its name. Clever eh!
Navigating to http://locahost:49503/health/status at this stage, results in the following JSON response (note how it contains not only the overall result but also that of each dependency which in my case is SQL Server):
| { | |
| "Entries": | |
| { | |
| "SQL Server": | |
| { | |
| "Data":{}, | |
| "Description":null, | |
| "Duration":"00:00:00.0208580", | |
| "Exception":null, | |
| "Status":2 | |
| } | |
| }, | |
| "Status":2, | |
| "TotalDuration":"00:00:00.0275908" | |
| } |
The “Status” field is a enumeration defined in the health checks package as follows:
| namespace Microsoft.Extensions.Diagnostics.HealthChecks | |
| { | |
| public enum HealthStatus | |
| { | |
| Unhealthy = 0, | |
| Degraded = 1, | |
| Healthy = 2 | |
| } | |
| } |
As you can see there is a whole lot of other useful information you can put in the health report but for now I have kept it simple. So far so good.
Part 2: Building a health check agent
As I mentioned before with Azure AppService model because you don’t get access to the underlying host, you can’t really install the DataDog agent that will be able to run the script, on the server.
I have found the following 2 ways to solve this problem:
- Using Azure WebJobs: set up a web job (either using Powershell script or C#) to run on a per minute interval, poll the endpoint and send the health metric to DataDog. The problem with this approach was that anytime I deployed a new version of the main application it would not only stop the main application but any web jobs that are defined under it as well. Not only that, the CRON based web jobs require the main application to be always on but that feature is only available in higher priced app service plans which I didn’t want/have the need, to do. The health checker script should certainly be a separate process so that it doesn’t go down with the app and defeat the purpose of health monitoring but it should also be always running. Enter approach 2, using Azure functions.
- Using Azure Functions (serverless approach) : Just like the web job but separate to the main application. I created a new function app in Azure and uploaded my function to it under the consumption plan i.e. it will deduct an amount from my free credits commensurate with my usage and because I don’t have to provision VMs or hosts, its a very short deployment cycle (CI/CD of Functions is out of scope for now). I could create one function per app per environment for isolation and to prevent over running the time budget of Azure functions which is 10 mins max and 5 mins default.
I liked the Azure Functions approach over Web Jobs because its lightweight and totally isolated from the main app which means as long as the function itself doesn’t crash, I will be able to monitor the health of my application reliably. In the event of the function crash, the best case scenario is that the Functions runtime will automatically restart it and the worst case is that it will stop sending metrics to DataDog which I can also set an alert for and take appropriate actions to resume telemetry.
Part 3: Building the monitoring dashboard in DataDog
Now that the metrics were being sent to DataDog, I needed a way to be able to visualise them in a meaningful way and create alerts.
To do this, I created 2 Timeseries dashboards: one for the overall app health tracking the “myapp.app.ishealthy” metric (told you naming the metrics/health checks will come in handy!) and another for the SQL Server backend tracking the “myapp.app.sql_server.ishealthy” metric. Note the namespacing in these metric names. This is a common pattern while submitting metrics to a StatsD compliant platform such as DataDog. You can read more about metrics here .
The query that these dashboards use to plot the metrics looks like this:
| { | |
| "requests": [ | |
| { | |
| "q": "avg:myapp.app.ishealthy{$environment}", | |
| "type": "bars", | |
| "style": { | |
| "palette": "dog_classic", | |
| "type": "solid", | |
| "width": "normal" | |
| }, | |
| "conditional_formats": [] | |
| } | |
| ], | |
| "yaxis": { | |
| "max": "2" | |
| }, | |
| "viz": "timeseries", | |
| "autoscale": true | |
| } |
Essentially what this says is “plot a bar graph for this metric averaged over the timespan being evaluated”. Because the metric is being published once every minute, if you are looking at a time window of, say, 1 hour you will see 60 bars each with a value of 1 (if the app is healthy) and the average also being 1. This will result in a neat looking bar graph that looks as shown below for a healthy application (status of 1 = healthy)
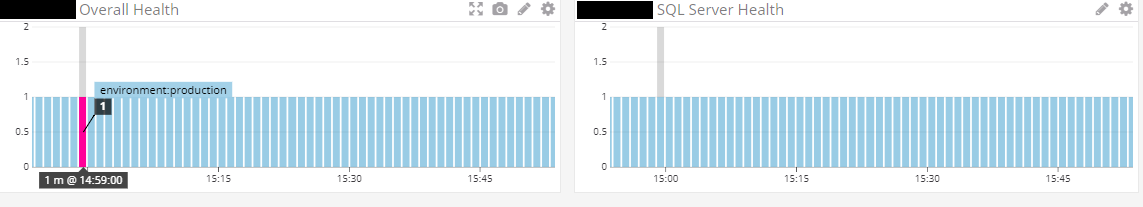
Each of those bars is a bucket of time into which the health check agent puts metric for each health check done at that instant in time. This enables metric at any given time to be correlated between graphs by simply hovering over a bar (the longer grey bar in the above screenshot).
Now let’s say the database for some reason becomes unavailable and therefore the application cannot connect to it anymore (this could happen outside the normal working hours and this is why monitoring is critical). The dashboard for unhealthy state will look like this (status of 2 = unhealthy):

Part 4: Setting up automated alerting.
Automated alerting is the final piece of the puzzle to close the health monitoring loop because if I don’t come to know that my application has gone unhealthy, I can’t fix it and it will sit there in a broken state with unhappy customers complaining. Not good for any self-respecting development team.
Therefore I set up a monitor in DataDog to send me an alert e-mail (this could easily be Slack or any other more real time communication channel), if the overall state of the application has been unhealthy for the last 30 minutes.
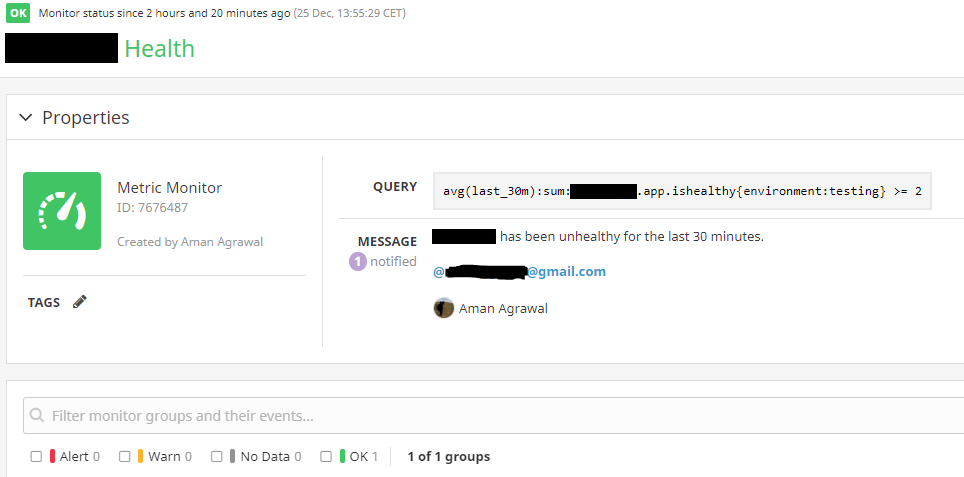
The 30 mins time restriction is to eliminate any transient faults that might self correct in a couple of minutes. Alerting is only for sustained and confirmed failures and what that looks like for an application will depend on what the application does and what’s the team’s SLA/SLO with its users.
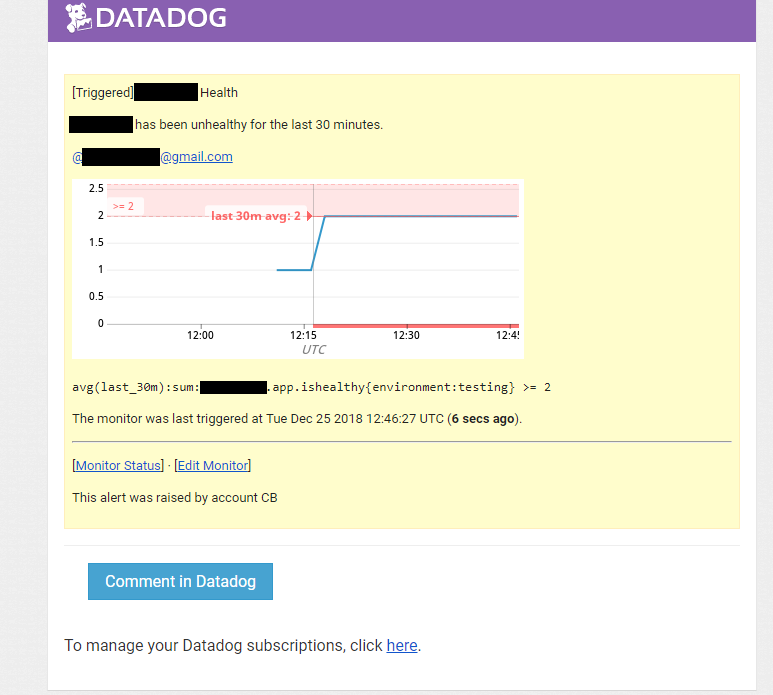
The alert e-mail looks like this:
Once this error condition has been resolved, the health dashboards will start returning back to normal i.e. status of 1:

And another e-mail will be fired off informing me of the recovery:

Some final points worth noting here:
- I used the DataDog REST API to submit metrics which may not be the most efficient way since its TCP based and it has to wait for acknowledgement. In the VM world, the metrics are normally sent to the DataDog agent that is local to a VM which then uses TCP to forward to the DataDog server. This is a little more efficient because the connection between the application and the local agent is over UDP and these calls don’t have to wait for responses/acks, plus, the local agent batches and buffers metrics before forwarding so if the datadog server went down, it would have very little effect on your app’s ability to log. In the App Service model, it isn’t possible to install an agent because you don’t have access to the underlying host. App Services allow you to install extensions but DataDog agent isn’t one of them, perhaps they will add it in the future.
- DataDog REST API, as of this writing, doesn’t have a C# client SDK so I had to use the vanilla HttpClient and custom DTOs to make metric submissions to DataDog. The count metric for e.g. has the following schema:
The long number is the POSIX timestamp in seconds since epoch and the way I generated that in C# is: DateTimeOffset.UtcNow.ToUnixTimeSeconds(). The metric count gets put into the time bucket as denoted by the POSIX timestamp and to represent the “points” structure in C# I created a “List<List<int>>” property in the DTO. Its critical to put related health metrics in the same time bucket otherwise you will lose correlatibility as the plots will be staggered.This file contains hidden or bidirectional Unicode text that may be interpreted or compiled differently than what appears below. To review, open the file in an editor that reveals hidden Unicode characters. Learn more about bidirectional Unicode characters
{ "series" : [ { "metric":"myapp.app.ishealthy", "points":[[1545526632, 1]], "type":"count", "tags":"Environment:Production" } ] } - Its important to attach appropriate tags to the metrics being sent for easier filtering and dashboarding. Environment being the most common tag used to differentiate between metrics. Metric names also must be chosen in a way that makes them unique per app for e.g. in my case, I used “myapp.app.ishealthy” with “Environment:Production” as tag. You could also attach other tags for e.g. “host” is another common one but with app service model it probably won’t make a whole lot of sense.
- I have not yet set up a CI/CD pipeline for the health checking Azure Function which means the deployment at the minute is FTP based. For this to be useable and useful for teams, there needs to be a way to automatically deploy an agent per application per environment exactly once at creation time of the new service. This needs to happen outside the main application’s deployment pipeline because once the agent is in place, it doesn’t need to change that often so it doesn’t need to be deployed with every app deployment. Working with VMs in this regard is a lot easier because you can make the installation of the DataDog agent and the health check script a part of the automated VM provisioning process. You still have to write the script yourself but once you get it right for your teams, it rarely ever changes. Case in point, the script that’s used at my work was last modified more than a year ago and its been serving 30 odd teams over hundreds of services and instances. If serverless functions approach is a bit too much work, you can always switch to using WebJobs but be aware of the limitations as aforementioned.

Hi , I looking for something where can check health of application in lower environments (SIT) this application is hosted on Azure VMs(Iaas). So I wanted to know health check of api’s and db of the application which is hosted in lower environments. My task is to create an application/api to get status of health of application in sit. Can you please suggest something on this. Awaiting for your response. Thanks in advance.
Without knowing your exact architecture its difficult for me say anything with certainty but off the top of my head I can think of several options you can look at:
1. The approach mentioned in this article i.e. have an external serverless function ping the health endpoint at regular intervals and send health metrics to the monitoring platform. Downside is that you are going to have to find a way to automatically discover new apps to monitor in your landscape or have some sort of registration mechanism exposed so that the function knows which apps to monitor. Or you will have to create a health checking function per app which is just repetitive work and wasteful.
2. Depending on the monitoring platform you are using, you might be able to install a local agent on the VMs that can hit the health endpoint on localhost at the designated port (because from its point of view, the app will be local and assuming there are no other web apps hosted on that VM that would contend for port 80). This local agent will then publish the health check results to the monitoring server, for e.g. Datadog has an agent that you can install on the VMs and configure it to ping the health endpoint and publish health metrics asynchronously. I am sure other monitoring platforms might have something equivalent. Since you are running IaaS, you will have to maintain and patch these agents yourself regularly. You are also going to want to make sure to have this agent pre-installed and configured on all new VMs so that applications can get benefit of health checks “out of the box”.
3. Although I haven’t used this myself, but apparently Azure Load Balancer (https://docs.microsoft.com/en-us/azure/load-balancer/load-balancer-custom-probe-overview) can also be configured to ping custom health endpoints for your backend VM pool (if you are running on VM Scale Sets) and report health metrics.
I am sure there are other better options but it really depends on what kind of architecture you’ve got and how much time you are willing to put in to configure all this, all these options will require some upfront work. Automation of a lot of this configuration will definitely help in the long run if you are scaling.
If you only have one VM running one app and the prospects of scaling are low, you could get away with just opting for approach 1. Hope some of this helps.