The way logging and instrumentation in code has traditionally been done is something like the below, say, I want to profile my application service method called “PeriodCloseReportAsync()” that gets called from my MVC controller action:
| public async Task PeriodCloseReport() | |
| { | |
| Stopwatch stopwatch = Stopwatch.StartNew(); | |
| var items = await this.periodService.PeriodCloseReportAsync(); | |
| stopwatch.Stop(); | |
| Log.Logger.Information( | |
| $"Method {nameof(IPeriodService.PeriodCloseReportAsync)} took {stopwatch.Elapsed.ToString()} to execute"); | |
| //.. return the result | |
| } |
This can be ok to a certain extent as long as the application is simple enough and you only intend to profile a few methods. This approach however, becomes very cumbersome and repetitive very quickly if you want to profile the entirety or a large part of your codebase. It starts to violate DRY (Don’t Repeat Yourself) big-time and if there is something we know in software engineering is repetition of code is bad and immoral, right? 😉 Well, may be not always but in this case it seems unecessary at the very least since much of that instrumentation code is the same no matter what method you are profiling and this case can certainly benefit from a centralised loosely coupled approach.
That approach is called Aspect Oriented Programming (AOP).
The core idea behind AOP is that it allows you the developer, to change the behaviour of code at runtime and separate the cross cutting concerns without changing the target code itself. One of the patterns that enables this is called the Decorator pattern and instrumentation profiling/logging is a perfectly suitable application area for this pattern. We want to inject timing code before and after the method call at runtime so we don’t need to write it out for each method by hand and risk mingling different concerns in code.
A class in .NET Standard that allows you to do this is called DispatchProxy in System.Reflection namespace (the .NET framework equivalent is RealProxy with some implementation differences). The idea is that you inherit from this base class to create a proxy to the type that you want to invoke methods against and then before each invocation you start a stop watch, stop it after the invocation and then log the elapsed interval (at the minimum). Its important to note that only those classes/types will be profiled that you create a proxy around, simply having a DispatchProxy implementation in your project won’t auto-magically do the profiling. This will become clearer in a bit.
Here’s what my implementation looks like (taking cues from here). I created this class right in my web application project as that’s what I am interested in right now:
| public class ProfilingProxy : DispatchProxy | |
| { | |
| private T decorated; | |
| private bool excludeProperties; | |
| private string[] methodsToExcludeFromProfiling; | |
| private IHttpContextAccessor httpContextAccessor; | |
| public static T CreateProxy(T decorated, | |
| IHttpContextAccessor httpContextAccessor, | |
| ProfilingConfiguration config = null) | |
| { | |
| // call the base class static method to create proxy instance, set the | |
| // passed in params and return it | |
| object proxy = Create(); | |
| ((ProfilingProxy)proxy).SetParameters(decorated, | |
| config, | |
| httpContextAccessor); | |
| return (T)proxy; | |
| } | |
| protected override object Invoke( | |
| MethodInfo targetMethod, object[] args) | |
| { | |
| object result = default(object); | |
| result = InvokeInternal(targetMethod, | |
| args, | |
| !ShouldNotProfile(targetMethod)); | |
| return result; | |
| } | |
| // See if the current method qualifies for not being profiled i.e. in the | |
| // exclusion list or a property with property exclusion enabled. | |
| private bool ShouldNotProfile(MethodInfo targetMethod) | |
| { | |
| return (methodsToExcludeFromProfiling != null && | |
| methodsToExcludeFromProfiling | |
| .Contains(targetMethod.Name)) || | |
| (targetMethod.IsProperty() && | |
| excludeProperties); | |
| } | |
| private object InvokeInternal( | |
| MethodInfo targetMethod, | |
| object[] args, bool doProfiling) | |
| { | |
| object result; | |
| Stopwatch stopwatch = null; | |
| if (doProfiling) | |
| { | |
| stopwatch = Stopwatch.StartNew(); | |
| } | |
| result = targetMethod.Invoke(this.decorated, args); | |
| // see if this method invocation was an async one | |
| var resultAsTask = result as Task; | |
| if (resultAsTask != null) | |
| { | |
| // if yes, then attach a continuation | |
| // when the original task completes | |
| resultAsTask.ContinueWith(task => | |
| { | |
| var property = task.GetType() | |
| .GetTypeInfo() | |
| .GetProperties() | |
| .FirstOrDefault(p => p.Name == "Result"); | |
| if (property != null) | |
| { | |
| // get the task result | |
| result = property.GetValue(task); | |
| if (doProfiling) | |
| { | |
| stopwatch.Stop(); | |
| Log.Logger.Information( | |
| $"ASYNC: Method {this.decorated.GetType().FullName}:{targetMethod.Name} executed in " + | |
| $"{stopwatch.Elapsed.ToString()} " + | |
| $"RequestId {this.httpContextAccessor.HttpContext.TraceIdentifier}{Environment.NewLine}"); | |
| } | |
| } | |
| }); | |
| } | |
| else | |
| { | |
| if (doProfiling) | |
| { | |
| stopwatch.Stop(); | |
| Log.Logger.Information( | |
| $"Method {this.decorated.GetType().FullName}:{targetMethod.Name} executed in " + | |
| $"{stopwatch.Elapsed.ToString()} " + | |
| $"RequestId {this.httpContextAccessor.HttpContext.TraceIdentifier}"); | |
| } | |
| } | |
| return result; | |
| } | |
| private void SetParameters(T decorated, | |
| ProfilingConfiguration configuration, | |
| IHttpContextAccessor httpContextAccessor) | |
| { | |
| this.decorated = decorated; | |
| this.excludeProperties = | |
| configuration?.ExcludeProperties ?? true; | |
| this.methodsToExcludeFromProfiling = | |
| configuration?.MethodNamesToExclude; | |
| this.httpContextAccessor = httpContextAccessor; | |
| } | |
| } | |
| /// | |
| /// A simple configuration data structure to pass to the to let | |
| /// it know which methods to exclude from profiling and whether or not to exclude properties from | |
| /// being profiled. The default of the ExcludeProperties will be treated as "true" by the | |
| /// ProfilingProxy internally | |
| /// | |
| public sealed class ProfilingConfiguration | |
| { | |
| public string[] MethodNamesToExclude { get; set; } | |
| public bool ExcludeProperties { get; set; } = true; | |
| } | |
| internal static class MethodInfoExtensions | |
| { | |
| internal static bool IsProperty(this MethodInfo methodInfo) | |
| => methodInfo.Name.StartsWith("get_") || | |
| methodInfo.Name.StartsWith("set_"); | |
| } |
I have added a couple of additional things to this implementation, namely, method and property exclusion options. By default this implementation profiles all methods in the proxied type but there may be times when you don’t want to profile all the methods in a class, so you can pass those method names to the proxy in an array and it will ignore them. It also ignores properties by default but you can override that behaviour by passing in appropriate ProfilingConfiguration instance.
I am also using Serilog here to log the method execution time for both sync and async methods. You can go crazy here and abstract the logging library out as well, but for my case I didn’t feel the need to since Serilog is pretty well abstracted and offers sinks of various types: text file, Azure table, Amazon DynamoDB etc and Serilog configuration happens at app startup which I can customise easily to change the log destination.
I have also included the HttpContext as one of the arguments to pass to the proxy since I am using this proxy for ASP.NET Core web apps for now and I want to use the HttpContext.TraceIdentifier as a correlation id in my logs to relate the logs for specific requests for easier analysis (I am sure there are better alternatives to that but for now, I am sticking with it). I am not a huge fan of speculative generality in the application architecture before the app is even launched and therefore I am not going to abstract everything from the get go in an attempt to make it fully re-usable across all app types just yet. I feel this is the best way to design systems that deliver value in the now and don’t over-promise for a future that I know nothing about.
To use this proxy, in the Startup.cs’ ConfigureServices() method, I call the static CreateProxy() method passing in an instance of the actual class (repositories, services etc) and any dependencies it might need from the IServiceProvider (assuming they have already been configured). These proxy instances are all request scoped since each request needs to be tracked individually and I don’t want to maintain any cross request state. I can also optionally provide an instance of ProfilingConfiguration class to the CreateProxy method to specify what to exclude from profiling:
| public void ConfigureServices(IServiceCollection services) | |
| { | |
| services.AddSingleton(); | |
| services.AddScoped(serviceProvider => | |
| { | |
| var proxy = ProfilingProxy.CreateProxy( | |
| new PeriodRepository(serviceProvider.GetService()), | |
| serviceProvider.GetService()); | |
| return proxy; | |
| }); | |
| services.AddScoped(serviceProvider => | |
| { | |
| var proxy = ProfilingProxy.CreateProxy( | |
| new ReportingRepository(serviceProvider.GetService()), | |
| serviceProvider.GetService()); | |
| return proxy; | |
| }); | |
| services.AddScoped(serviceProvider => | |
| { | |
| var proxy = ProfilingProxy.CreateProxy( | |
| new PeriodService(serviceProvider.GetService(), | |
| serviceProvider.GetService()), | |
| serviceProvider.GetService()); | |
| return proxy; | |
| }); | |
| //...other dependencies | |
| } |
At this point I should make it clear that this kind of proxying of methods may add some overhead to the overall execution, I haven’t measured it but I doubt it will be too severe , nevertheless, it will be present because reflection is involved and there are branches to evaluate before the code is able to log the execution time and this might skew the logged time ever so slightly. It shouldn’t be significant enough to degrade the overall app performance but just to allow myself an option, I have also added a global configuration flag (in my appSettings.json file) that enables me to turn off profiling altogether (for library code at the moment).
| { | |
| //...other configs | |
| "EnableLibraryProfiling": true | |
| } |
I also cleaned up the code a little bit so the ConfigureServices() method in Startup.cs doesn’t become too bloated. For this I created a simple IServiceCollection extension class with one method that adds all my services to the application DI container based on whether or not profiling is enabled at the config level:
| internal static class ServiceCollectionExtensions | |
| { | |
| internal static IServiceCollection AddLibServices( | |
| this IServiceCollection services, bool enableProfiling) | |
| { | |
| if (enableProfiling) | |
| { | |
| services.AddScoped(serviceProvider => | |
| { | |
| var proxy = ProfilingProxy.CreateProxy( | |
| new PeriodRepository(serviceProvider.GetService()), | |
| serviceProvider.GetService()); | |
| return proxy; | |
| }); | |
| services.AddScoped(serviceProvider => | |
| { | |
| var proxy = ProfilingProxy.CreateProxy( | |
| new ReportingRepository(serviceProvider.GetService()), | |
| serviceProvider.GetService()); | |
| return proxy; | |
| }); | |
| services.AddScoped(serviceProvider => | |
| { | |
| var proxy = ProfilingProxy.CreateProxy( | |
| new PeriodService(serviceProvider.GetService(), | |
| serviceProvider.GetService()), | |
| serviceProvider.GetService()); | |
| return proxy; | |
| }); | |
| } | |
| else | |
| { | |
| services.AddScoped(); | |
| services.AddScoped(); | |
| services.AddScoped(); | |
| } | |
| return services; | |
| } | |
| } |
Then the ConfigureServices() method then just calls my extension method passing in the globally configured flag value which defaults to true to enable profiling in case the global config key is not found or wrong:
| public void ConfigureServices(IServiceCollection services) | |
| { | |
| services.AddLibServices( | |
| Configuration.GetValue("EnableLibraryProfiling", true)); | |
| //...other dependencies | |
| } |
For controller actions, I decided to use an IActionFilter implementation to profile them.
| public class ControllerActionProfilingFilter : IActionFilter | |
| { | |
| private Stopwatch stopwatch; | |
| public void OnActionExecuted(ActionExecutedContext context) | |
| { | |
| stopwatch.Stop(); | |
| Log.Logger.Information( | |
| $"Action {context.ActionDescriptor.DisplayName} " + | |
| $"executed in {stopwatch.Elapsed.ToString()} " + | |
| $"RequestId: {context.HttpContext.TraceIdentifier}{Environment.NewLine}"); | |
| } | |
| public void OnActionExecuting(ActionExecutingContext context) | |
| { | |
| Log.Logger.Information( | |
| $"Profiling {(context.Controller as Controller).Request.Path} " + | |
| $"RequestId: {context.HttpContext.TraceIdentifier}{Environment.NewLine}"); | |
| stopwatch = Stopwatch.StartNew(); | |
| } | |
| } |
Add this filter to the global set of filters that will apply to all controllers and actions:
| public void ConfigureServices(IServiceCollection services) | |
| { | |
| //... | |
| services.AddMvc(options => | |
| { | |
| options.Filters.Add( | |
| new ControllerActionProfilingFilter()); | |
| }); | |
| } |
This decouples it from the library profiling and if you choose to disable library profiling altogether using the config flag mentioned above, the IActionFilter will still give you controller action level log. You can also get this level of telemetry logging by default if you are using Azure Application Insights, so you have options you can pick and choose from that are best suited for your needs. The key difference between the two is the former approach doesn’t tie you to specific platform i.e. Azure. You can log all traces to a file or some other storage medium on a different platform for e.g. Amazon DynamoDB. Serilog provides packages for various sinks that you can use to log data to so you are not tied to a specific platform. In this example, I am just using a rolling text file that gets stored on the server hard disk that my application is running from (the app itself is hosted on Azure), this way I can save money on additional logging storage for e.g. Azure Tables if I had gone down that route. Although, its a good practice not to put logs in text files on the server hard disk and risk losing all that valuable data if the hard disk crashes or the file is accidentally deleted. My preferred and recommended approach would be to store the logs in a separate storage platform such that running log analytics will be easier using something like the ELK stack or NewRelic or AppInsights. Key is to separate log storage from the main application data storage so that problems in one don’t affect the other.
The logs generated when the application runs through its paces, look like this:
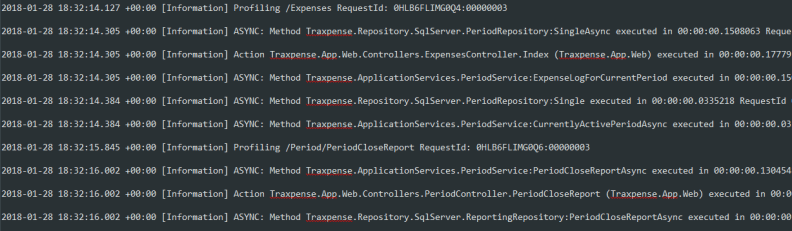
Log structure can be changed as per your needs and this is the one thing Serilog is really good at- structured logging. Overall I like this approach of centrally adding instrumentation to the code without actually changing anything in the target code itself at compile time. I am sure with a few more tweaks around customisability this approach can be refined.
I put this code in my hosted app about a week ago and so far I haven’t seen any performance degrades because of it..but then me and my wife are the only ones using it so I guess that’s not exactly indicative of much! May be if I had millions of users, things will probably be different. 🙂

Hi Aman,
Thanks for sharing this.
Can you please share the github repo for the same, I wish to see your implementation.